Infographics Illustration commissioned by iGas explaining the natural gas exploration & production process
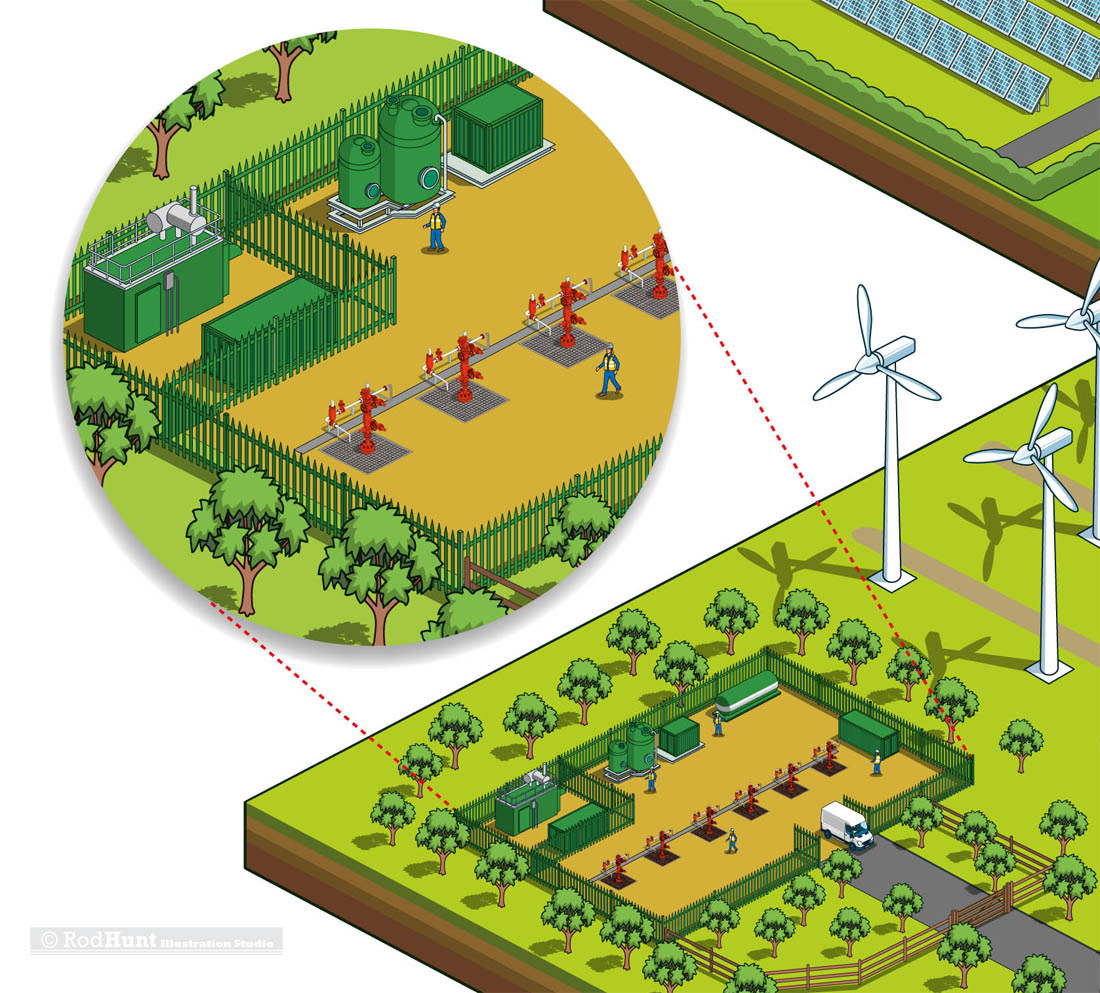
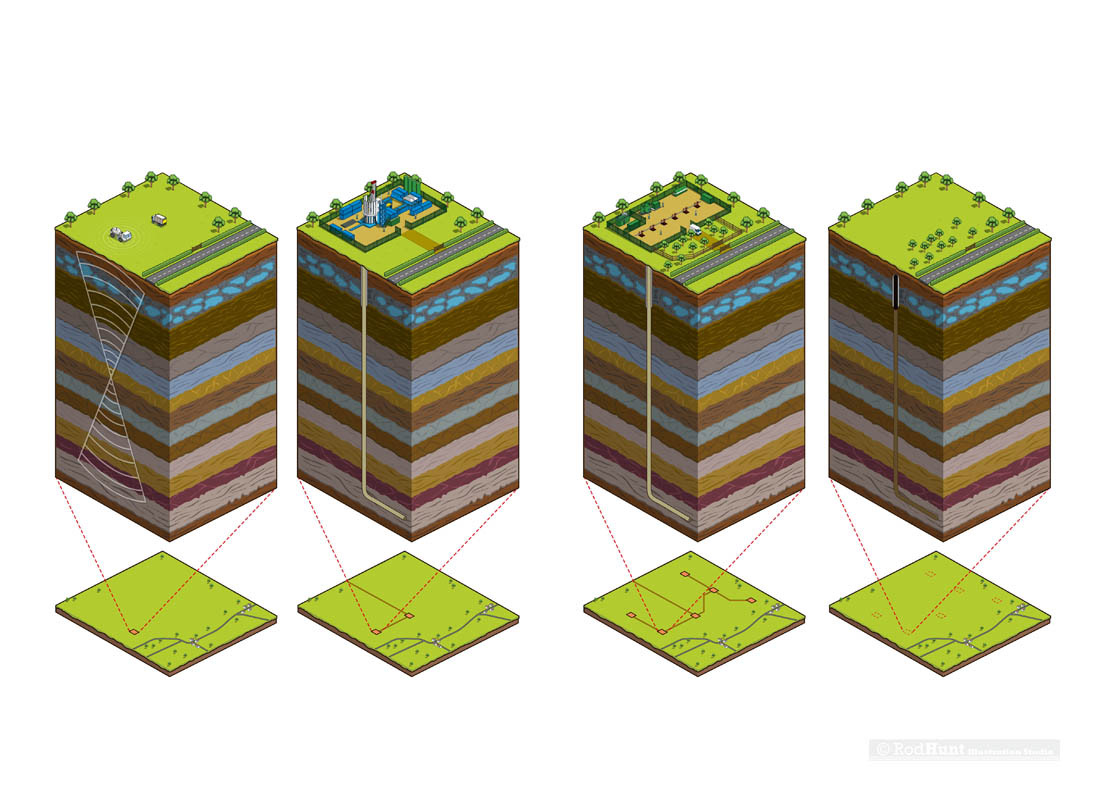
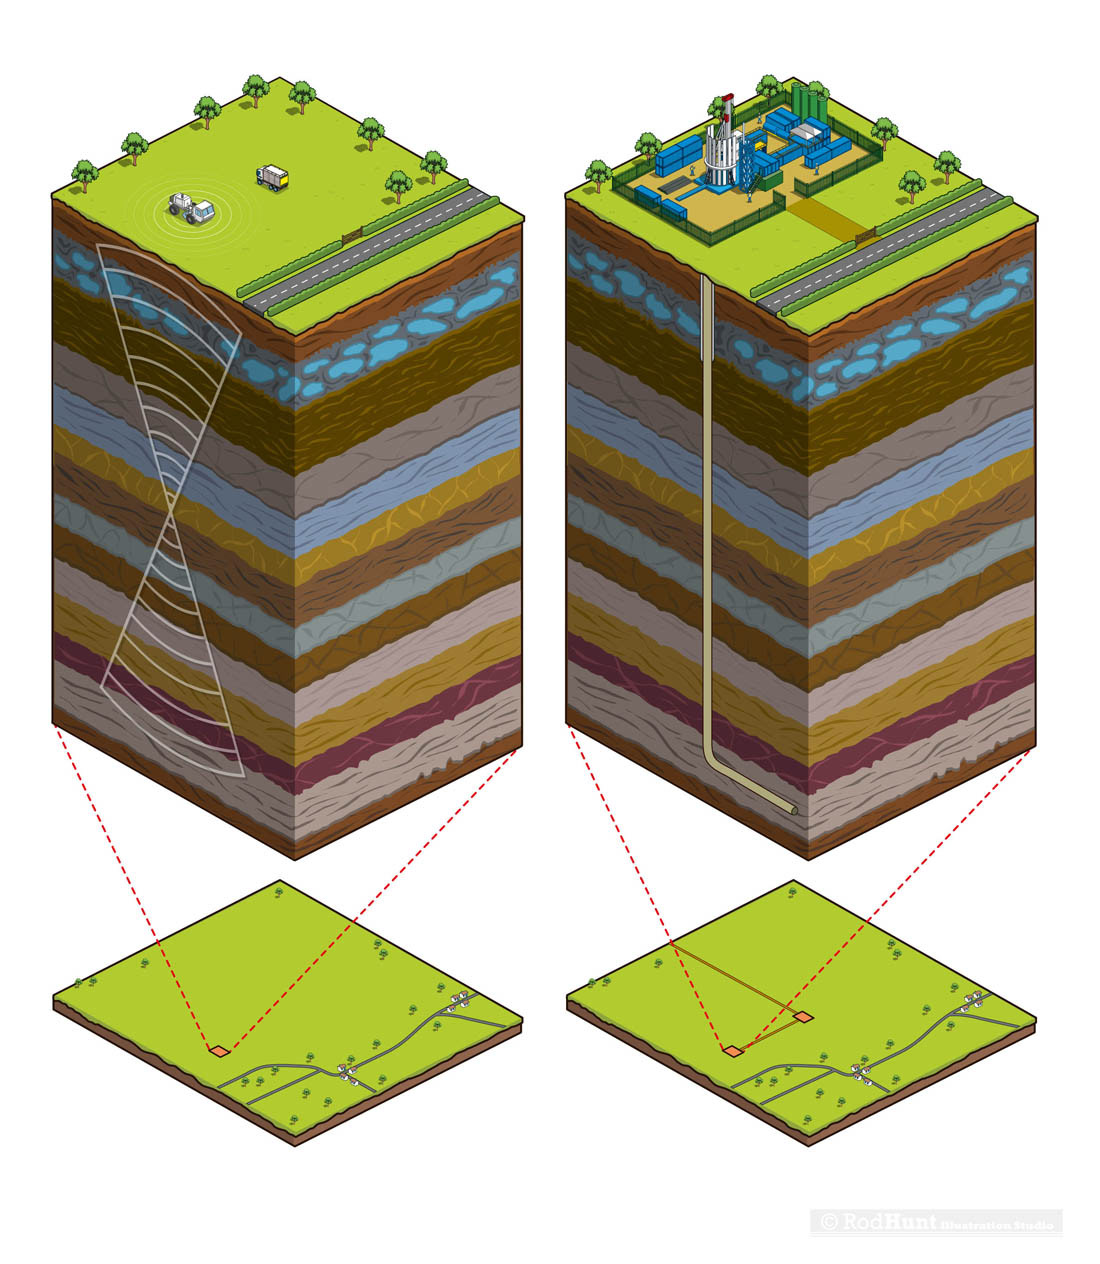
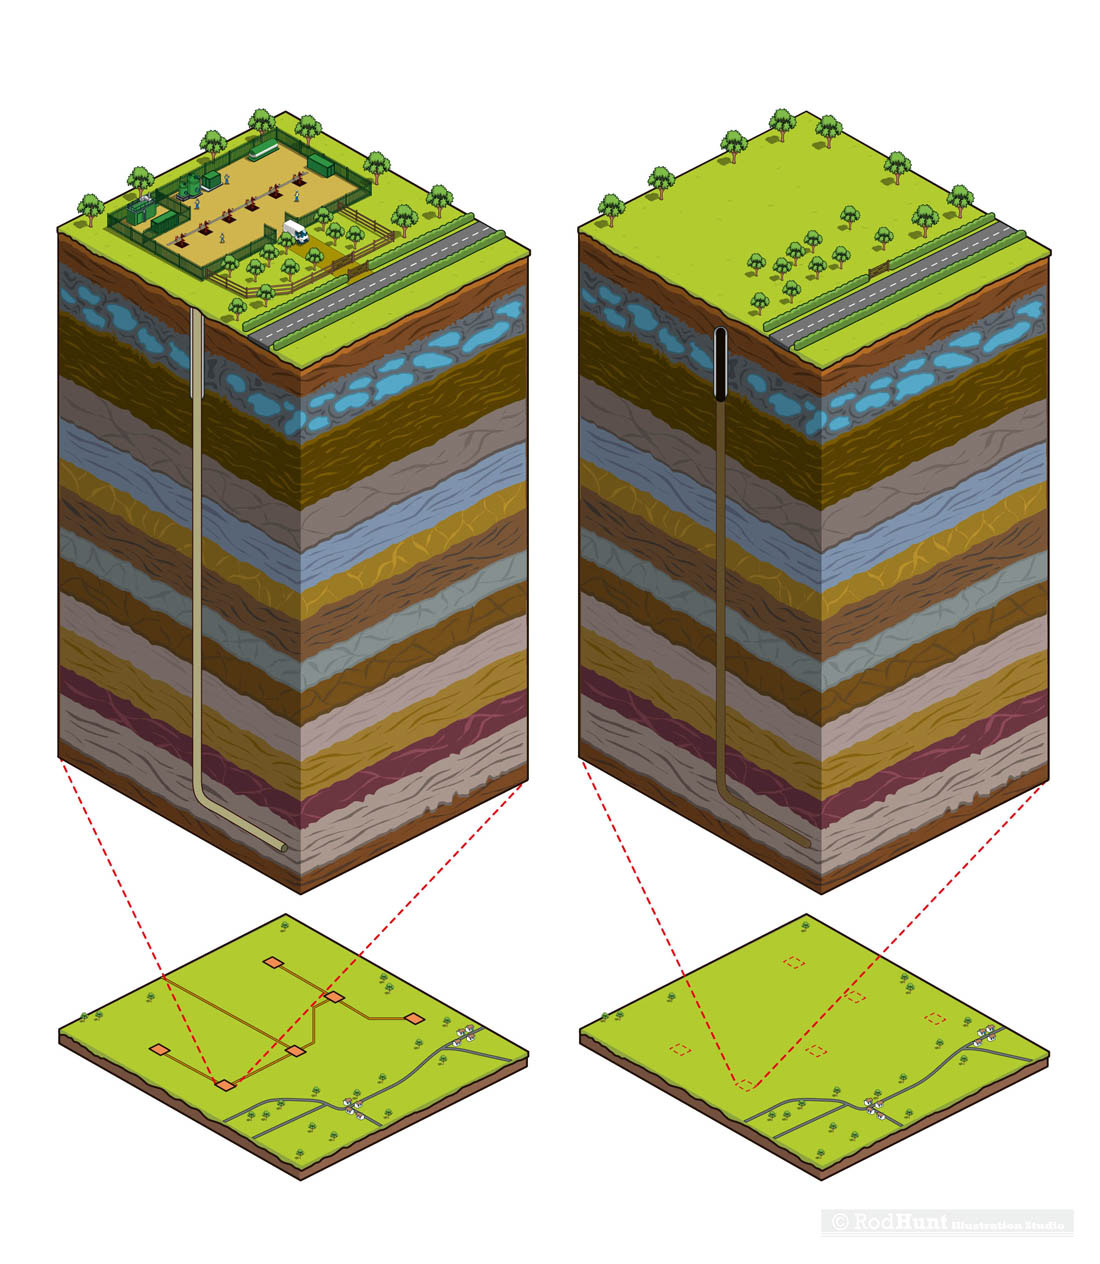
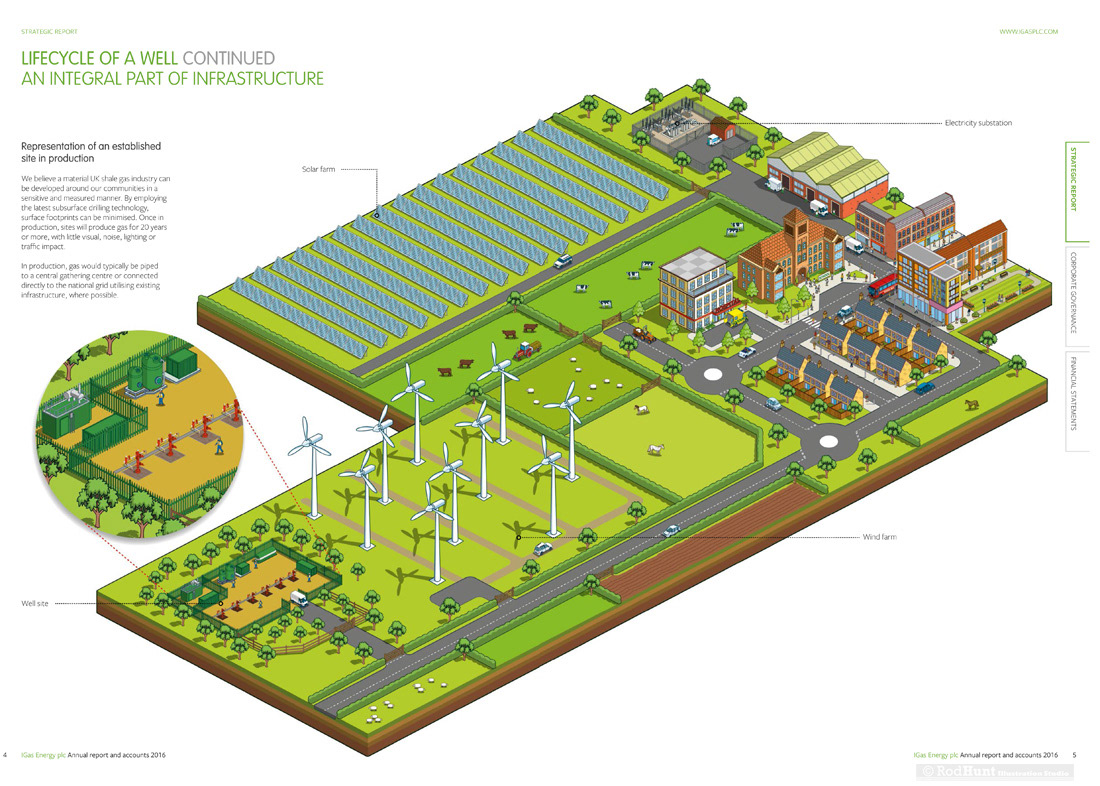
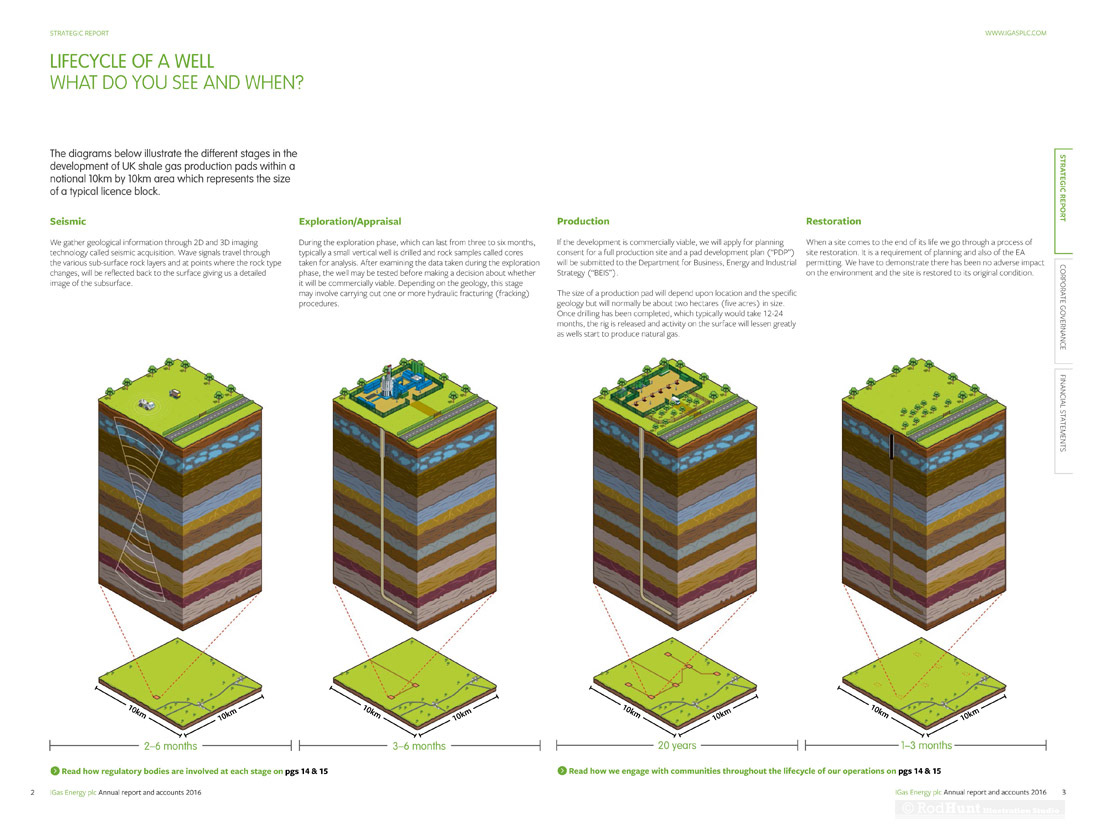
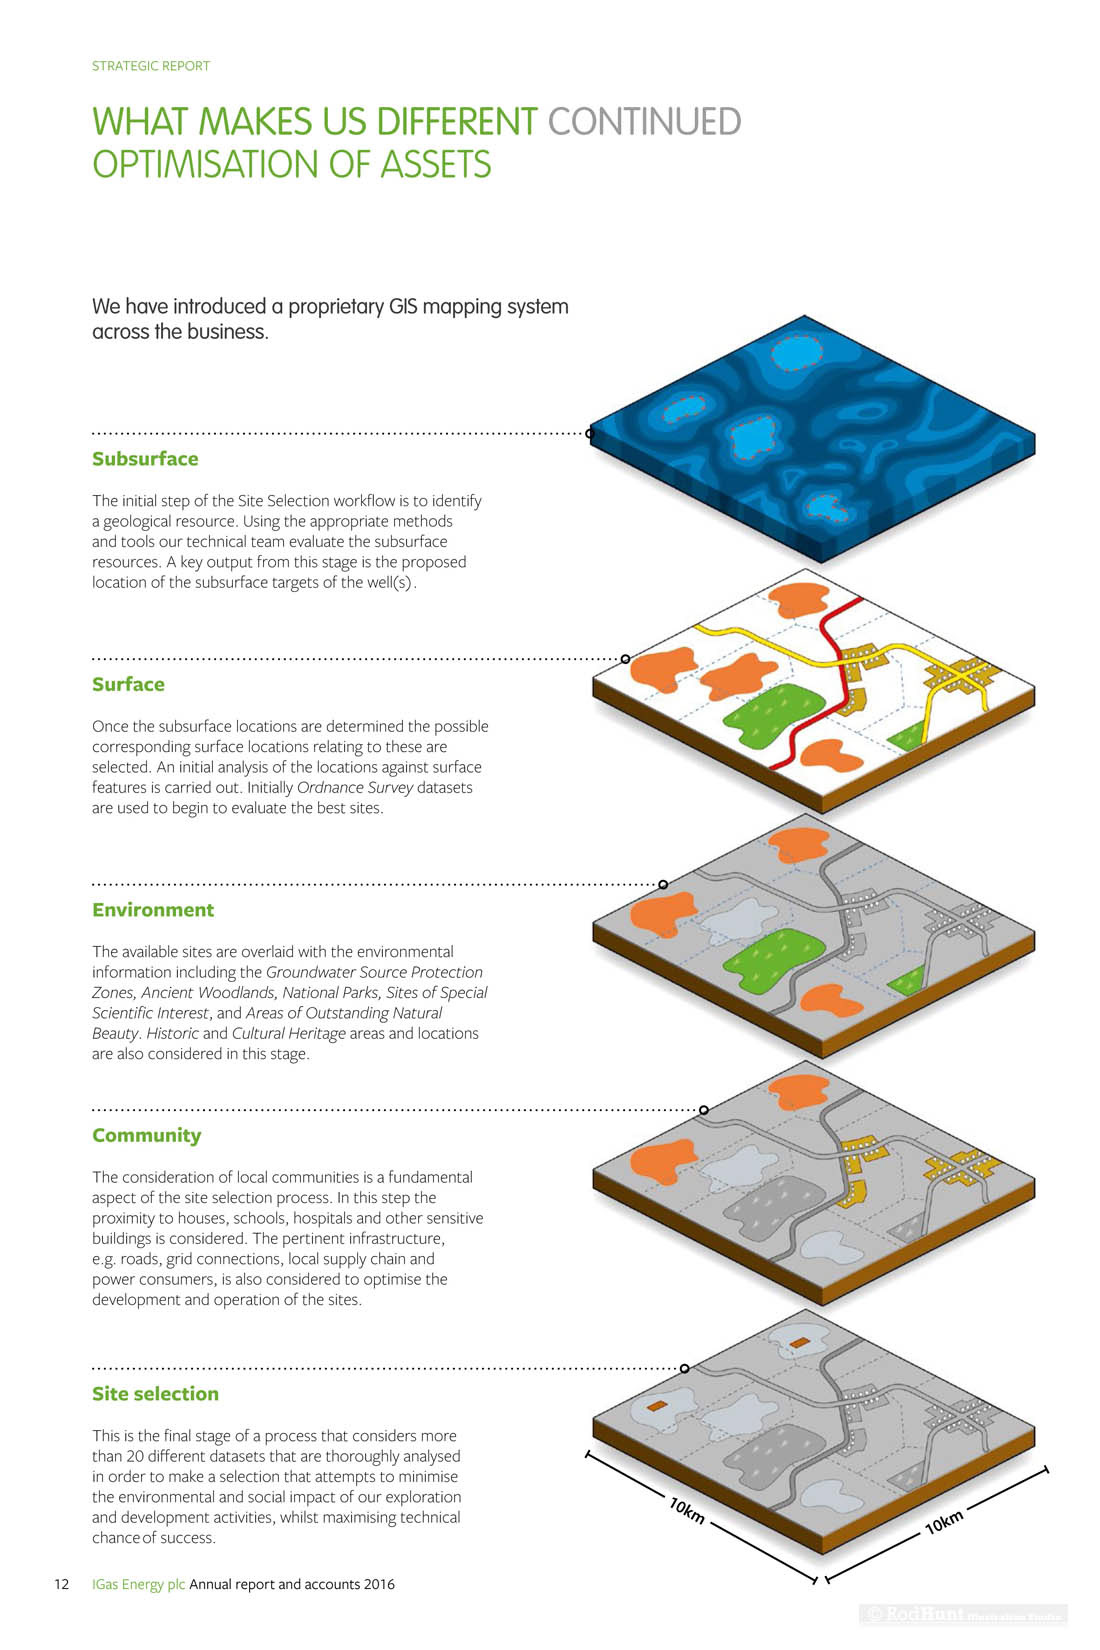
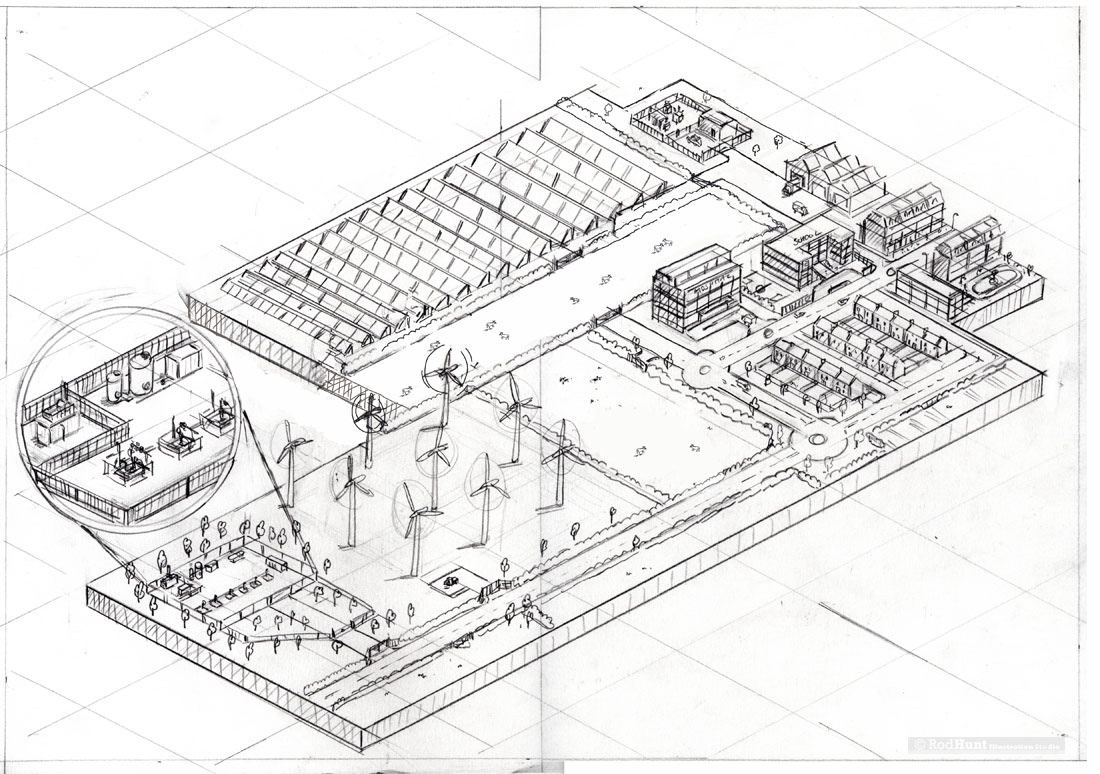
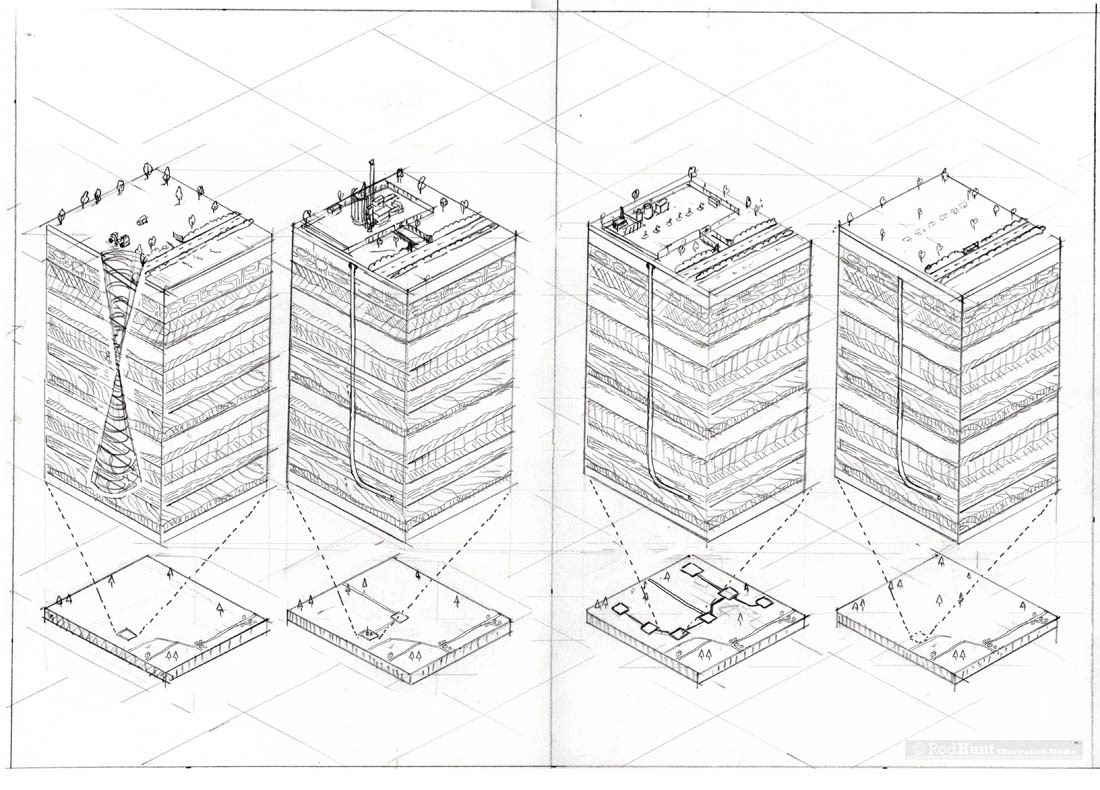
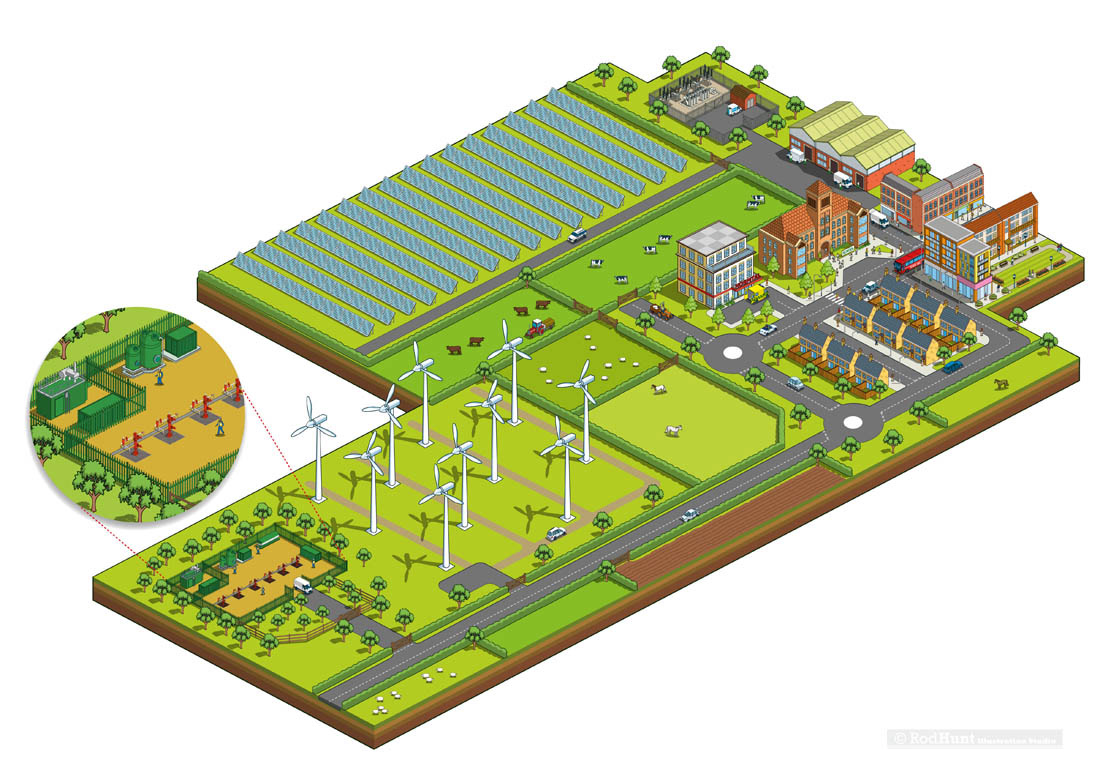
Rod Hunt was commissioned by Carr Kamasa Design to create a series of illustrations for the IGas Energy plc 2017 Annual Report. Three infographic illustrations were created to explain the exploration and production process; Lifecycle of a Well, Representation of an Established Site in Production and Optimisation of Assets. 
IGas Energy plc is a leading onshore oil and gas exploration and production business
Isometric information graphics illustration - business & the energy sector
Infographic Illustrator - Cross sections cutaway illustrations of the landscape showing rock strata & natural gas reserves
Infographic Illustrators - 3D diagrams, infographics for business and the energy industry by illustrator Rod Hunt
Infographic Illustrator -Isometric business illustrations
Infographic Illustrators - Landscape illustrations in 3D isometric perspective
Information Graphics Annual report illustrations for an energy production company
Isometric Information graphics landscape for business in isometric perspective
Hand drawn maps for business and the energy industry
Cutaway cross section illustrations
Back to Top