Infographic illustration for The Bank of England showing the circulation on money in the UK economy - Isometric infographics illustrations
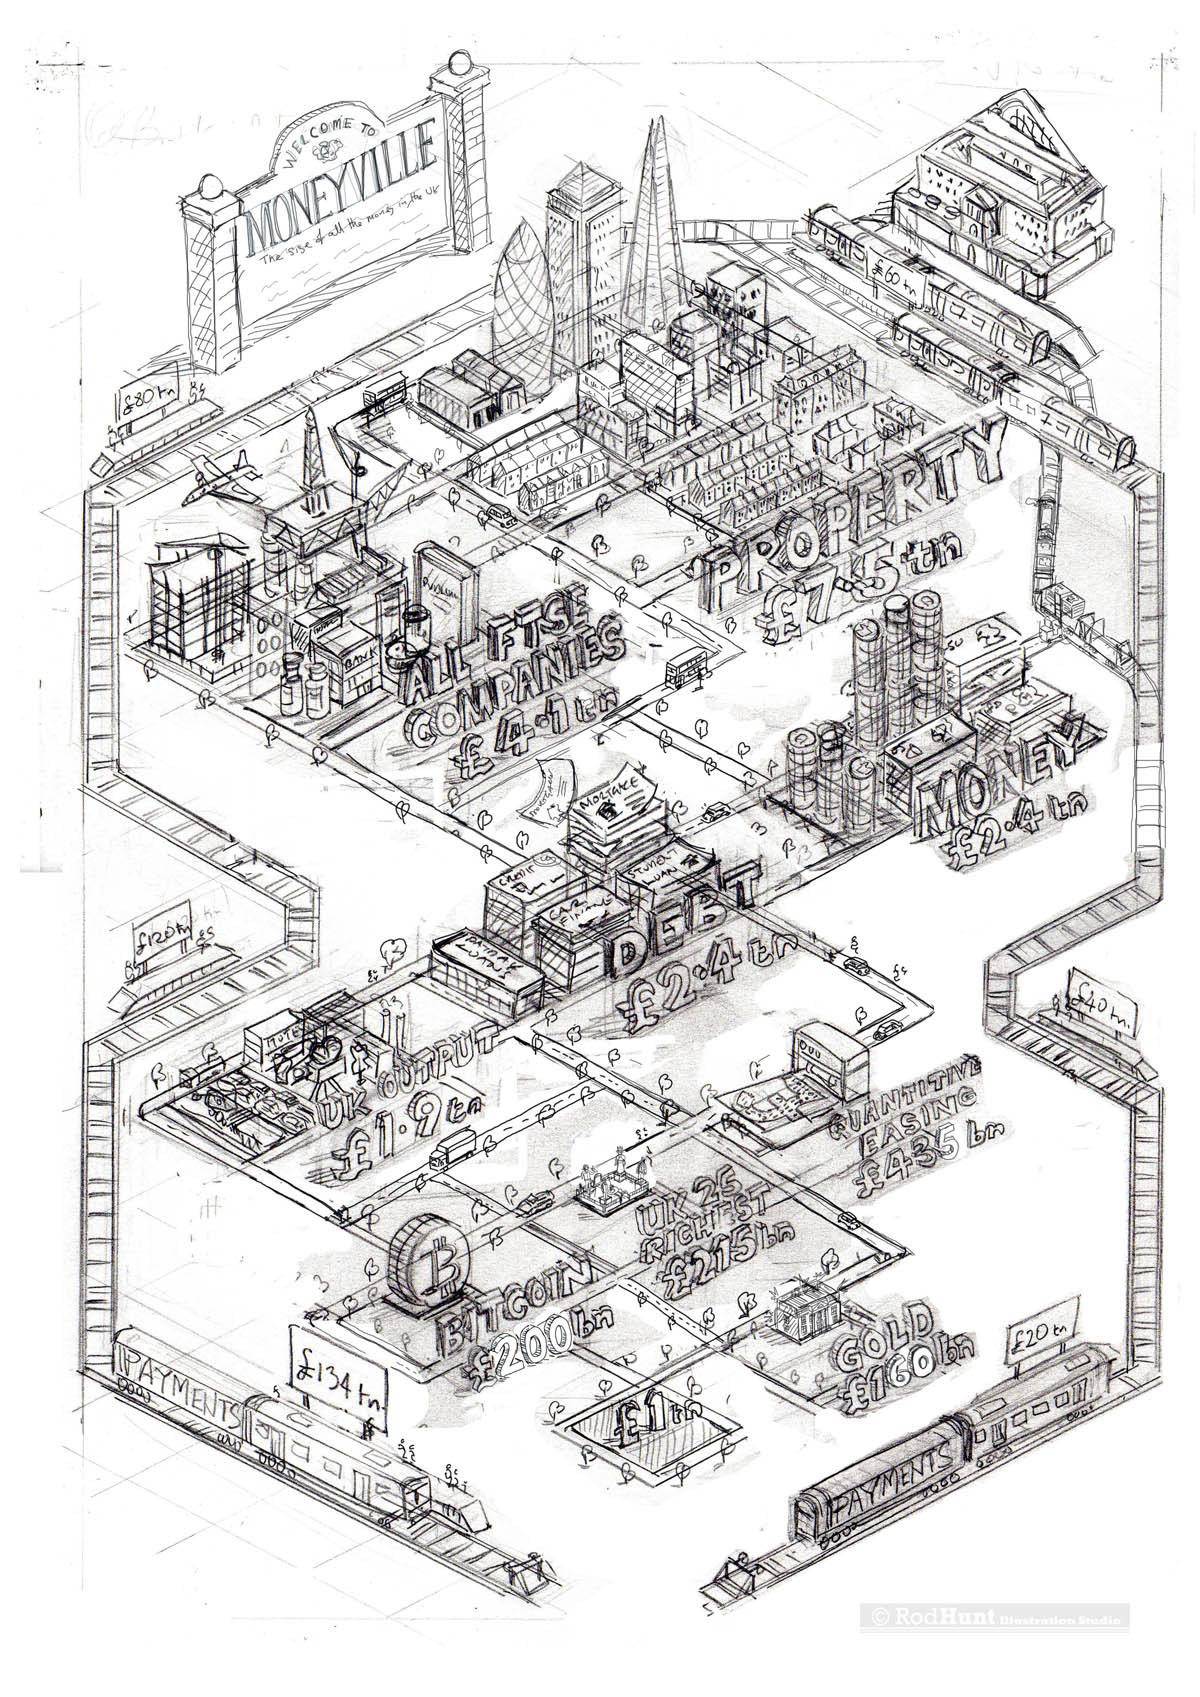
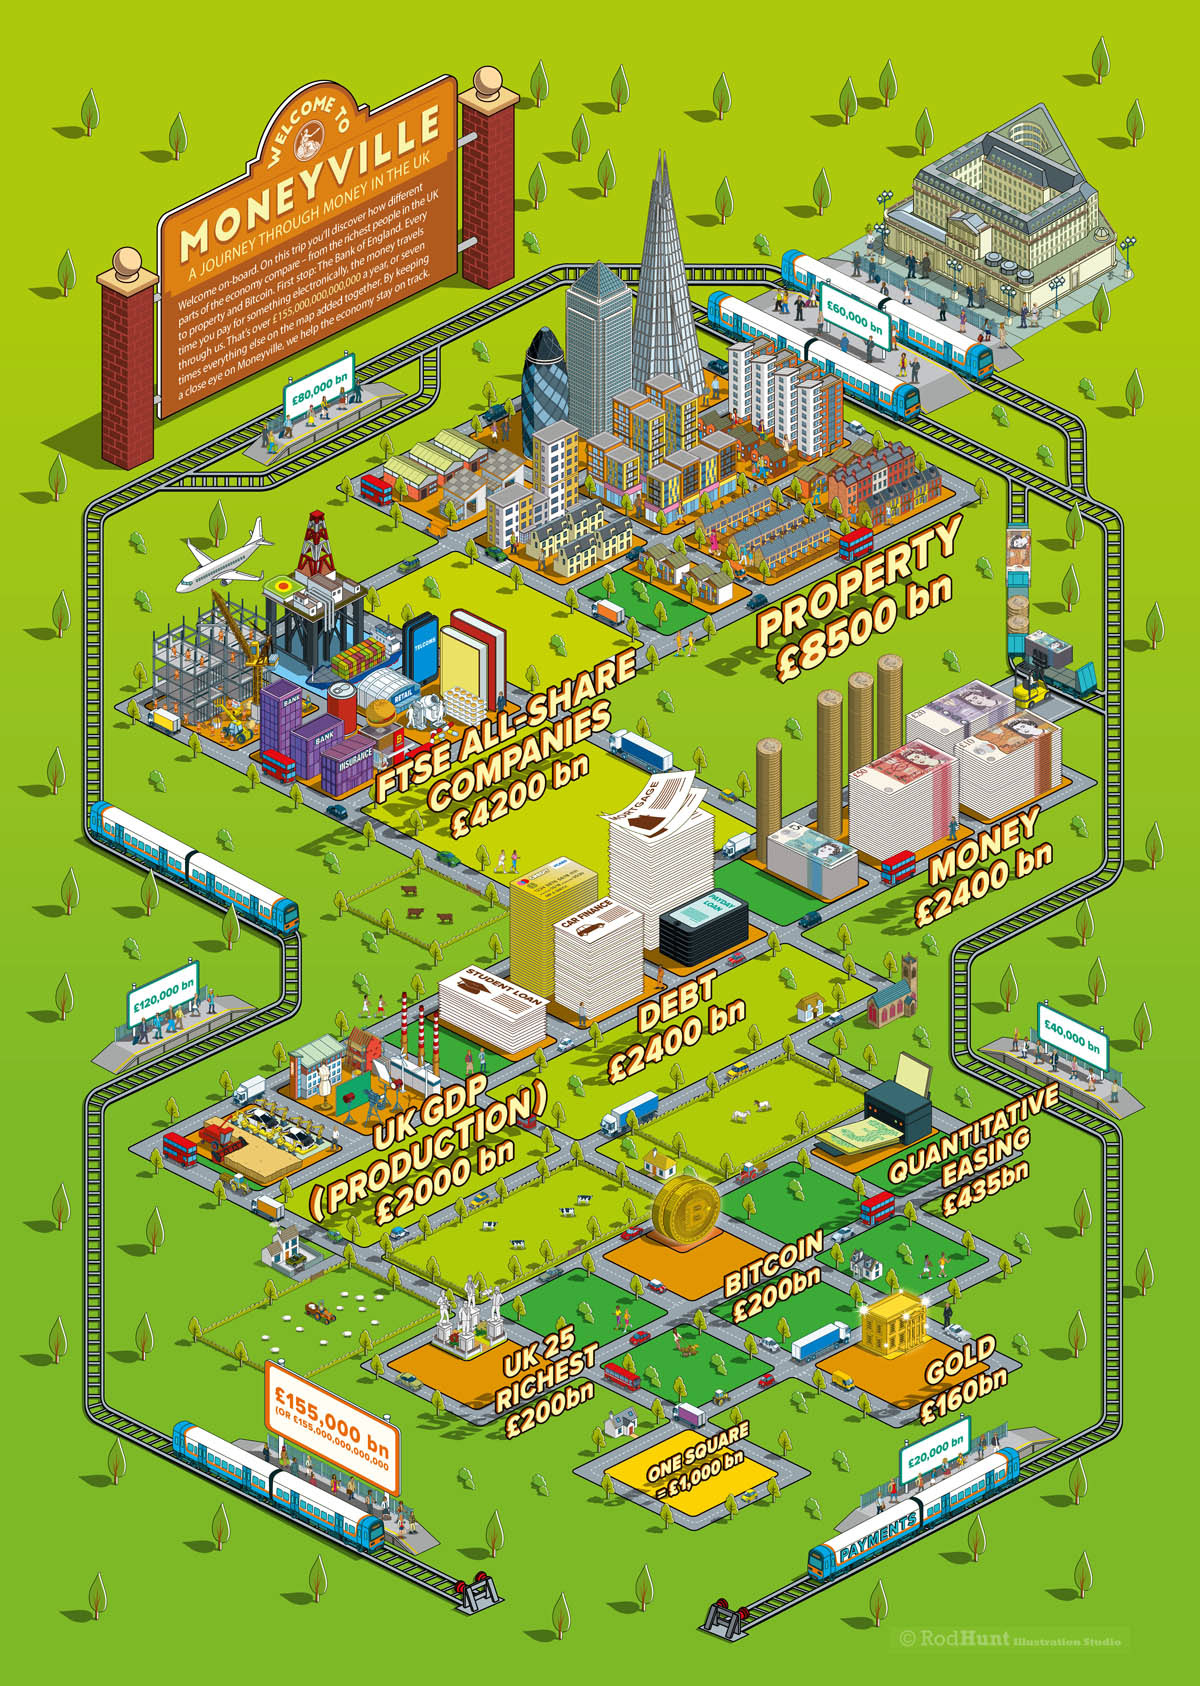
Rod Hunt was commissioned by Art Director Matteo Ruisi at the Bank of England to illustrate 'Welcome to Moneyville - A Journey Though Money in the UK'a 70x100cm poster to be given to students as part of the Bank of England's educational programme. The infographic needed to show is a clear and immediate way the amount of money that circulates in the UK, divided into the different sectors of the economy.

Welcome to Moneyville - A Journey Though Money in the UKWelcome on-board. On this trip you’ll discover how different parts of the economy compare – from the richest people in the UK to property and Bitcoin. First stop: The Bank of England. Every time you pay for something electronically, the money travels through us. That’s over £155,000,000,000,000 a year, or seven times everything else on the map added together. By keeping a close eye on Moneyville, we help the economy stay on track.
Information Graphics Illustrator - The UK economy infographic for The Bank of England Education Programme
Isometric infographics illustration for business, banking and financial sector
Infographics Illustrator - Illustrated lettering and typography used in infographic illustrations
Infographics Illustrators - Cityscapes illustrated as part of a information graphic visualising money in the UK economy - The Bank of England
Infographics - Industry and business illustrated in 3D isometric perspective
Infographic Illustrations - Finance & sectors of the UK economy
Business and money Information graphics by infographic illustrator Rod Hunt
Infographic Educational poster illustration - The Bank of England
Information Graphics Posters for education explaining money in the UK economy
Infographics Printed posters for economics students & schools
Infographics Illustrators - Isometric poster illustration, finance, banking, business, government
Illustrated infographic visualisation - UK economy
Back to Top